Projects and their statistics
A project is the vessel of tasks: every task belongs to a project, and a project gathers what serves one goal — "new website", "tax season", "branch opening". Good project slicing is what makes the statistics meaningful.
Who is this page for?
Whoever organises the group's work; reading is open to members.
The projects page
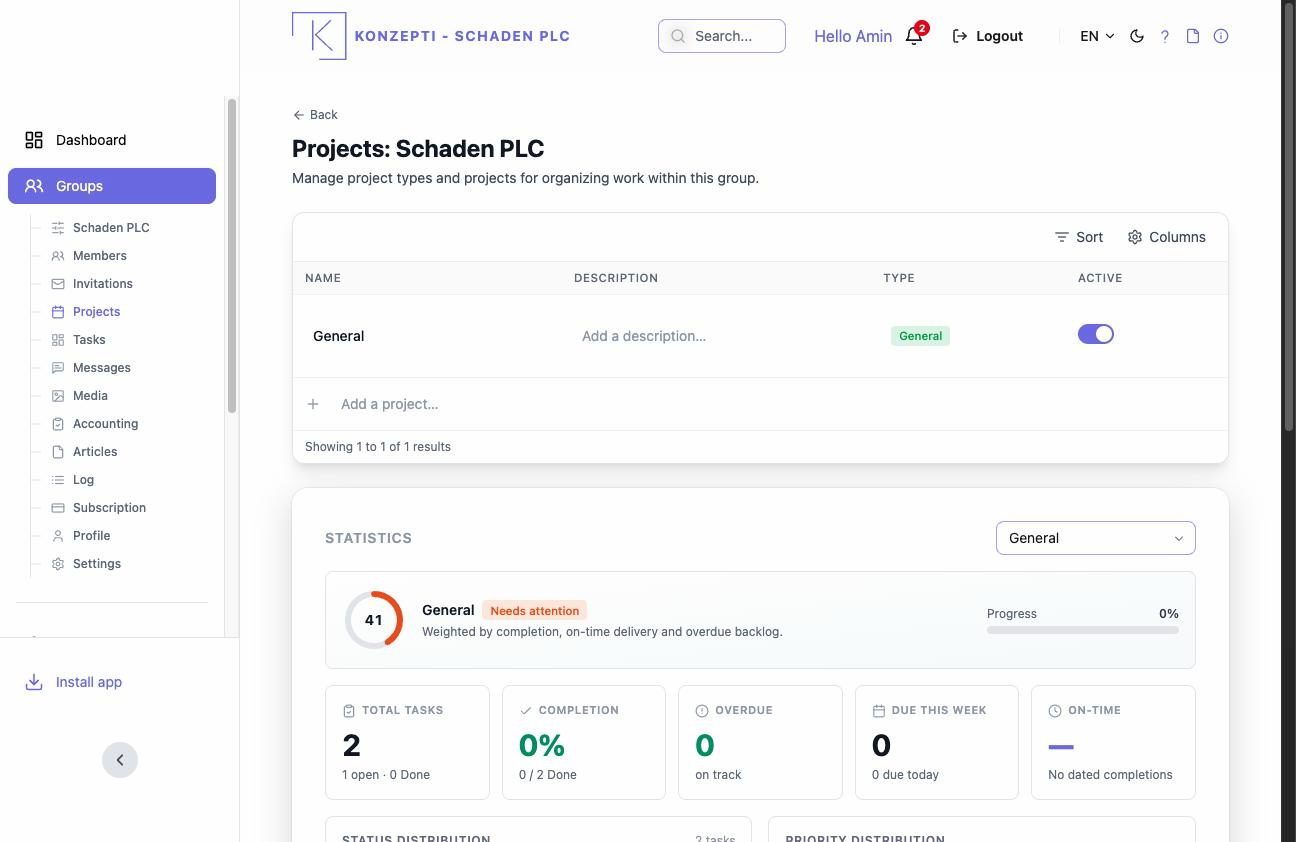
A list of the group's projects: name, description, type and state are edited in the row itself. Adding happens through the "Add a project…" row — see Adding a project.
The statistics
Selecting a project shows its Statistics:
- Health — is the project on track? With counters for open, done, Overdue, due today and due this week.
- Task distribution over statuses and priorities, and the completion rate.
- Throughput — what got done across recent weeks.
The numbers follow the tasks' properties — due date, priority, status — neglect those on the tasks and the statistics ring hollow.
What you see after
The new project appears as a choice in the task editor, and the Tasks page filters by it.
Common mistakes
- One huge project for everything — the statistics lose their meaning.
- Due dates left empty, then wondering why "Overdue" and "Throughput" stay blank.